Mid-Year Economic and Fiscal Outlook 1996-97
Corrigendum
9 Items
This corrigendum replaces the general government sector tables in the Mid-Year Economic and Fiscal Outlook 1996/97. The revised figures are confined to the General Government sector. The budget sector data throughout the document is unaffected.
The Commonwealth General Government sector comprises both the budget and non-budget sectors. The budget sector, which dominates the general government sector and is the basis of the budget documentation, consists of those departments and agencies whose transactions are recorded on the Commonwealth Public Account (CPA). The non-budget sector includes Commonwealth government authorities such as the ABC and CSIRO, which operate outside the CPA through their own bank accounts.
Item 1:
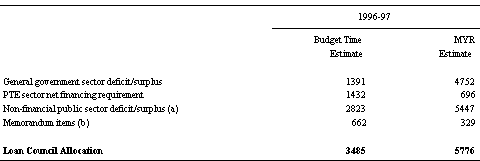
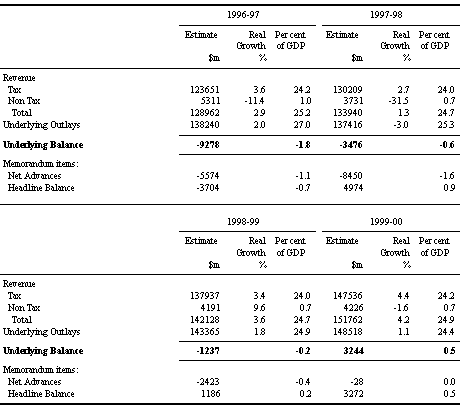
Replace Page 14, Table 7: Summary of General Government Aggregates with:
Table 7: Summary of General Government Aggregates

Item 2:
Replace Page 15, Paragraph 1, Line 2
in deficit by $8.1 billion. Although comparable estimates were not published in the
with:
in deficit by $9.3 billion. Although comparable estimates were not published in the
Item 3:
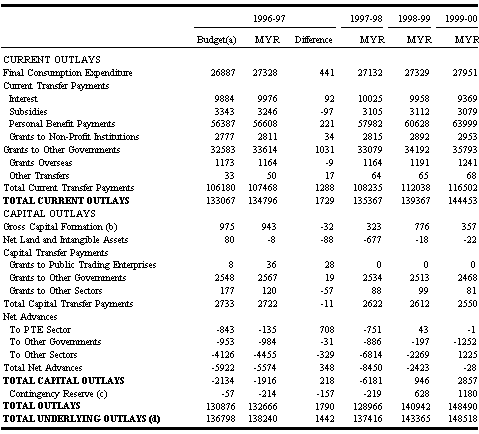
Replace Page 26, Table 15: Estimates of Commonwealth General Government Outlays with:
Table 15: Estimates of Commonwealth General Government Outlays
Item 4:
Replace Page 27, last paragraph with:
There have been several significant changes in the estimates since the 1996–97 Budget. Most of the differences can be explained by the change in the methodology. Current Grants to Other Governments has increased by $1031 million, $701 million attributable to the budget grants to the States. The remainder includes an omission in the general government data at budget time of $323 million. Personal Benefits Payments have increased by $221 million with an increase of $631 million in the budget sector, offset by a decrease of $410 million in the non-budget sector primarily due to a revision of the Health Insurance Commission's estimate of amounts to be paid in 1996–97. Final Consumption Expenditure has increased by $441 million, one quarter of which can be attributed to the budget sector. Net Advances to the PTE sector changed by $708 million due to the slippage from 1996–97 to 1997–98 of a repayment from the Snowy Mountains Hydro-Electric Authority. Net Advances to Other sectors have changed by $329 million mainly due to a change in the budget sector numbers. The Contingency Reserve also changed by $157 million and is totally attributable to the budget sector.
Item 5:
Replace Page 28, Table 16: Changes to General Government Outlays by Economic Type Since the 1996–97 Budget ($m) with:
Table 16: Changes to General Government Outlays by Economic Type Since the 1996–97 Budget ($m)
Item 6:
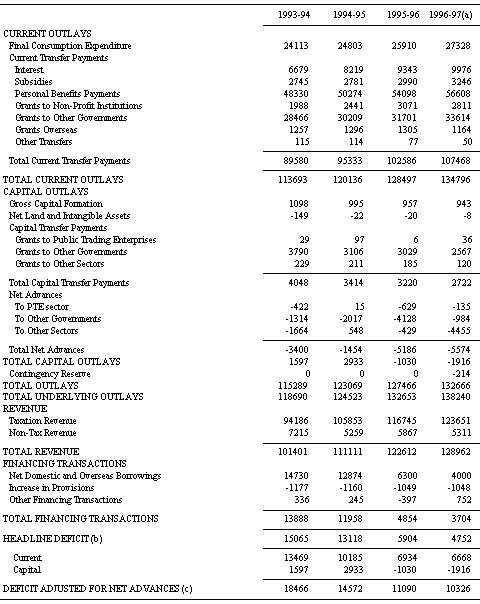
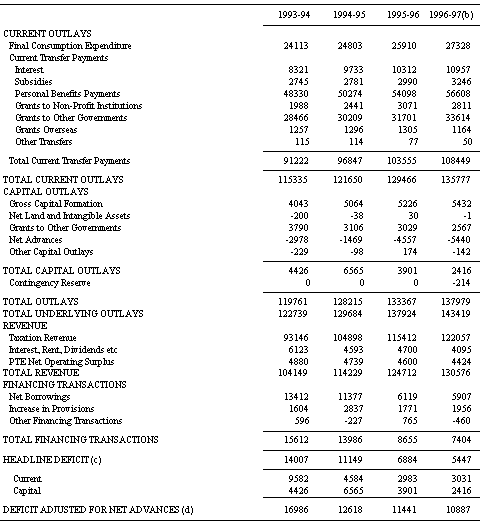
Replace Page 91, Table 25: Commonwealth General Government Sector by Economic Type ($m) with:
Table 25: Commonwealth General Government Sector by Economic Type ($m)
Item 7:
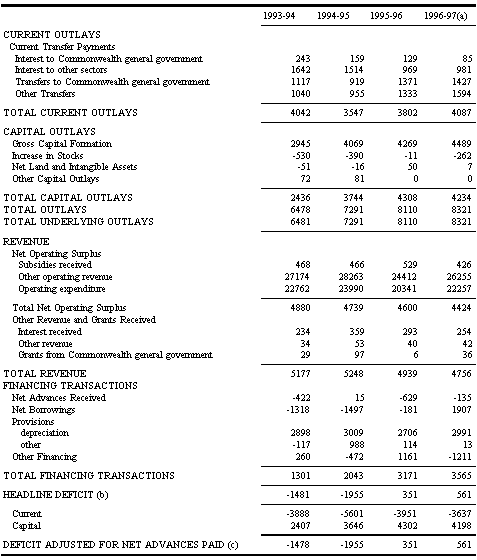
Replace Page 92, Table 26: Commonwealth Public Trading Enterprise Sector by Economic Type ($m) with:
Table 26: Commonwealth Public Trading Enterprise Sector by Economic Type ($m)
Item 8:
Replace Page 93, Table 27: Commonwealth Government Sector by Economic Type ($m) with:
Table 27: Commonwealth Government Sector by Economic Type ($m)
Item 9:
Replace Page 94, Table 28: Loan Council Allocation ($m) with:
Table 28: Loan Council Allocation ($m)
